| Dec. 28, 2021
What is PPFD (Photosynthetic Photon Flux Density)?
PPFD is the total number of photons hitting one square meter per second from the light source within the PAR range, and is written asμmol/m2s (orμmol m-2 s-1). The quantum sensor that measures PPFD is used to determine the amount of PAR light reaching the crop canopy from the light source. These sensors measure the amount of PAR light reaching a certain point per second and use the readings on the sensors to estimate a value of one square meter. This is similar to a completely uniform light source, such as sunlight, but for artificial light, many readings should be taken within one square meter to obtain an accurate average PPFD measurement value, because the result will reach the maximum value directly under the light, and then weakened all around. Of course, these light sensors may be expensive for growers, so GKhorti will usually help customers to conduct professional tests on their lights and generate PPFD maps of different heights for reference.
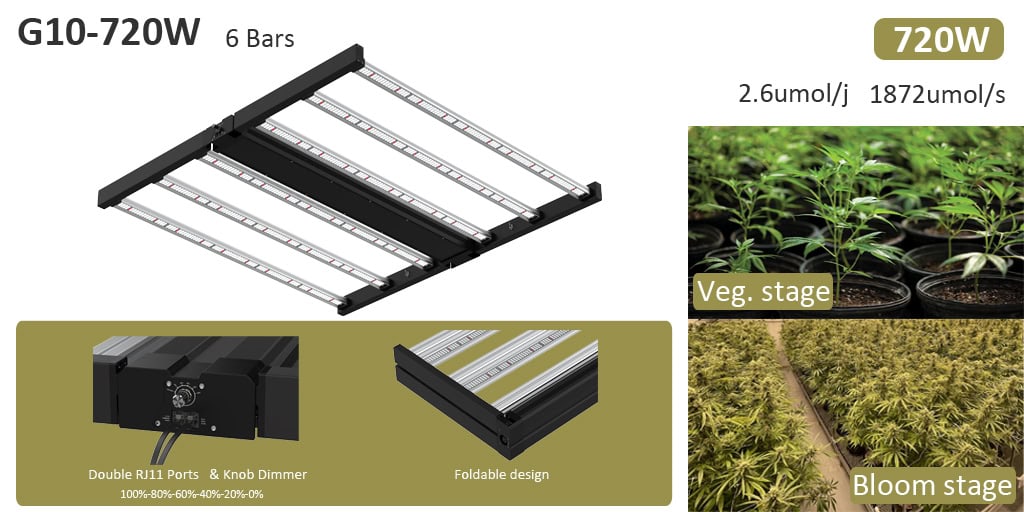
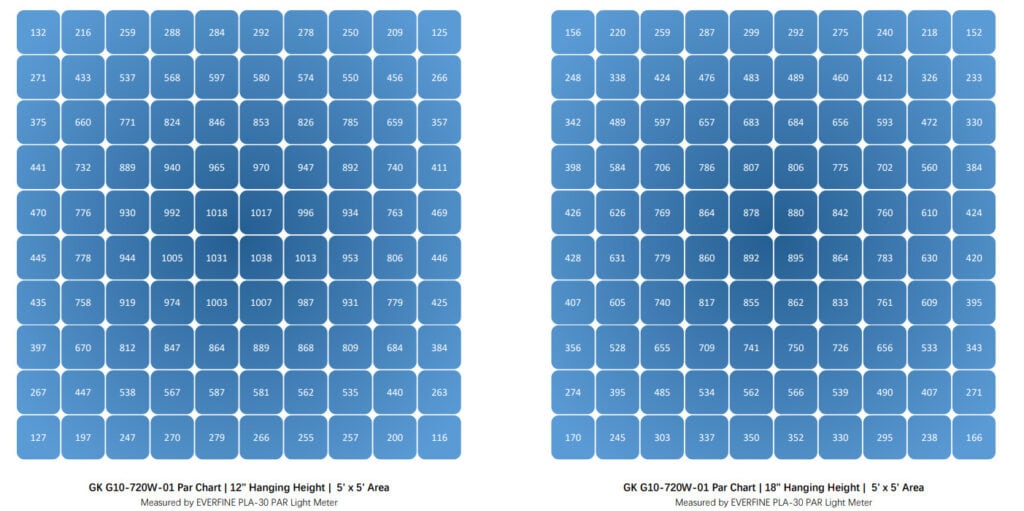
A PPFD map is a grid that can display PPFD values measured at multiple points on a specific surface area at a specific distance. For example, we might hang a lamp required by the customer on a surface of 30 cm (12 inches) at a distance of 150 cm x 150 cm (5 feet x 5 feet), and perform 100 measurements (15 cm apart). These maps are useful when buying plant growth lights, especially when growing cannabis strains indoors. For example,for our G10-720W model, we will provide customers with the average PPFD of the designated growth area at different heights according to the area of the customer’s planting house and the measured height.

Figure 1 G10-720w

Figure 2 GK- G10-720W PPFD MAP
For growers, it is very important to ensure that the PPFD data obtained from the manufacturer for their lamps is accurate and covers the entire lamp area. Therefore, you need to consider factors such as the distance to the lamp, the number of average measurements, and the minimum/maximum ratio before purchasing.
However, if you are growing in a greenhouse, then you need to understand more than PPFD first, there is also a very important data—DLI.
Understanding Daily Light Integral (DLI)
For greenhouse growers, if they rely only on natural light for planting, then the intensity of light will continue to change, every day, every week, every season… this shows that your plants get different light at all times . So, how do we determine that the amount of light received by your plants is sufficient? An effective way is to learn to manage DLI (Daily Light Integral) by yourself. In greenhouse planting, growers need to understand that having DLI data can clearly tell us how much sunlight hits our planting area at a specific time of the year, and we can calculate our greenhouse how much light should be added to achieve the best PAR. This can directly affect the operational efficiency of the farm, which is why GKHorti calls on more growers to pay close attention to the DLI maps of different regions,because it can help each gardener to have a deeper understanding of how their farms can improve efficiency.
What is DLI?
Daily light integral (DLI) is the amount of PAR received each day as a function of light intensity (instantaneous light: μmol·m-2·s-1) and duration (day). It is expressed as moles of light (mol) per square meter (m-2) per day (d-1), or: mol·m-2·d-1 (moles per day). This indicator is very important, because for cannabis and other light-loving plants, the amount of light obtained in a day The quantity has the most direct relationship with its growth, development, yield and crop quality.
DLI for greenhouse gardening
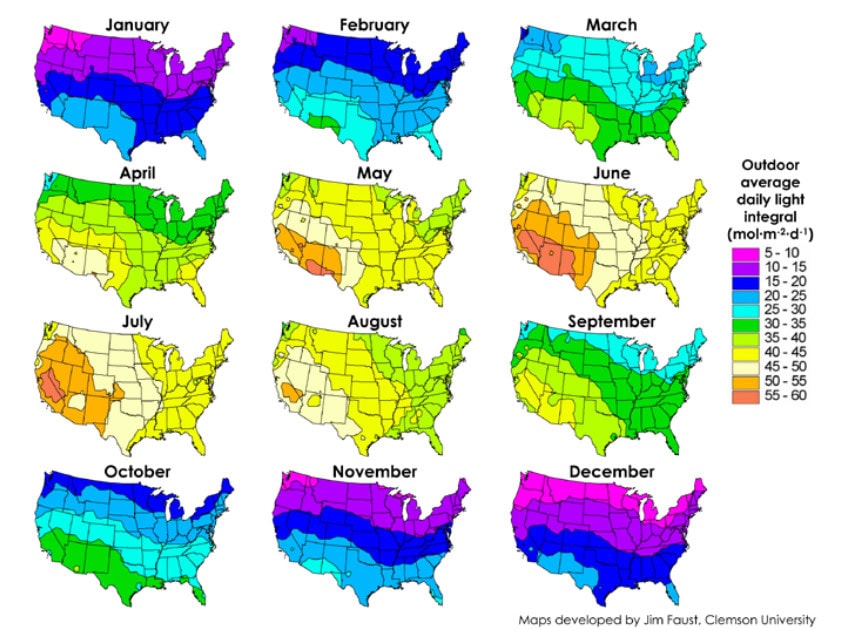
DLI is an important variable measured in every greenhouse because it affects the growth, development, yield and quality of plants. For example, DLI can affect the growth of roots and shoots of seedlings and cuttings, the completion of plant quality (features such as branches, number of flowers, and stem thickness) and time. Commercial growers who regularly monitor and record the DLI received by their crops can easily determine when additional lighting or retractable shades are needed. In addition to light intensity, there are other factors that can determine DLI. Different latitudes and lengths of time in various regions will affect your DLI. Outdoors, DLI ranges from 5 to 60 mol·m-2·d-1 throughout the year, but in a greenhouse, DLI is more susceptible to factors such as glass materials, greenhouse roof structure, seasons, clouds, and day length.
Understanding DLI is particularly important for growers in northern latitudes, because the DLI value of outdoor sunlight from December to early March may only be between 5 and 30 mol·m-2·d-1. In the greenhouse, it is affected by various factors. These values will drop by 20% to 70%, so the average DLI in the greenhouse is only 1 to 5 mol·m-2·d-1, it is simply not enough for most plants that require flowering and reproduction. Even in other seasons, DLI will vary greatly depending on the weather. But growers who manage DLI can easily determine the data and quickly set up planting plans, such as supplementing lighting or using retractable sunshades.

Figure 3. Maps of monthly outdoor DLI throughout the United States.
Source: Mapping monthly distribution of daily light integrals across the contiguous United States (Pamela C. Korczynski, Joanne Logan, and James E. Faust; Clemson University, 2002)
In order to obtain more accurate results, there are also methods that can be used to measure the DLI received by your crop. We recommend connecting a quantum light sensor to a data logger to record the instantaneous light intensity, which is then used to calculate DLI. Knowing your specific environment DLI (the amount of sunlight in the greenhouse) allows you to determine how much supplemental light is needed to meet the crop’s DLI goals. You can easily calculate or supplement DLI for your environment using the following equation:
DLI = ((Average intensity within 24 hours, the unit is μmol·m-2·s-1)*(3600*24)) / 1,000,000

Nevertheless, manually managing DLI is a time-consuming process and often an imperfect method. Using GKHorti’s high-efficiency adjustable ceiling lamps G12-1000W, we can develop a suitable lighting scheme for you according to the geographical location and measurement data provided by the customer, without having to guess how much DLI your greenhouse needs. We can also develop a separate light simulation map for you, allowing you to clearly see the light distribution in the greenhouse. With our technology, your lighting will automatically stabilize the target light level regardless of the season, climate, shadow, or transmittance, thereby increasing your output.
